 When it comes to investing in the stock market, the goal is to always come out of any trade with more money than you started with.
Most investors are happy to take these easy earnings as soon as they come through, while others hold out and hope to double their profits in the process.
The trickiest part about being a shareholder is knowing exactly when to get in and when to get out. But if you play your cards right, doubling your money in the market can be chump change in comparison to the riches that are really out there.
Take Tandem Diabetes Care (TNDM) for example. Since the start of this year, the company has increased its stock price by a whopping 2,353%!
Here are some of the warning signs that could’ve given you the green light to buy-in to this kind of trade before it took off.
Before we get underway, let’s unpack this percentage gain for what it is and see what it translates to in terms of cash.
Considering a 100% profit effectively doubles your money, this 2,353% that came along with a TNDM investment throughout 2018 is the same as multiplying your money 22 times over!
Back in February, share prices for Tandem Diabetes Care were as low as $2.14, but fast-forward to the latter half of this year and this value increased to a high of $52.55.
That’s over $50 in profits PER SHARE!
Just think, if you happened to buy 100 shares of TNDM 10 months back, then you’d be $5,041 richer by now.
I think you get the picture…
There’s no doubt that owning shares in Tandem Diabetes Care would’ve put some serious profits in your pocket, but enough hypothetically speaking.
How do you avoid missing out on these returns the next time they come around?
While it’s next to impossible to catch every single one of these market increases, you can use fundamental and technical analysis as a way to get ahead of these profits before they take place.
When I say fundamental analysis, I’m simply referring to current events that have the potential to affect Wall Street.
Some fairly recent examples of this are the Cambridge Analytica scandal that pulled Facebook’s (FB) stock down and the trade tariffs imposed by President Trump, which impacted various industries.
My point is, it’s important to do a little research beforehand, rather than aimlessly investing in companies.
On the other end of the spectrum, there’s technical analysis. This basically deals with the numbers, charts and graphs related to particular stocks.
Take a look at the chart for TNDM below…
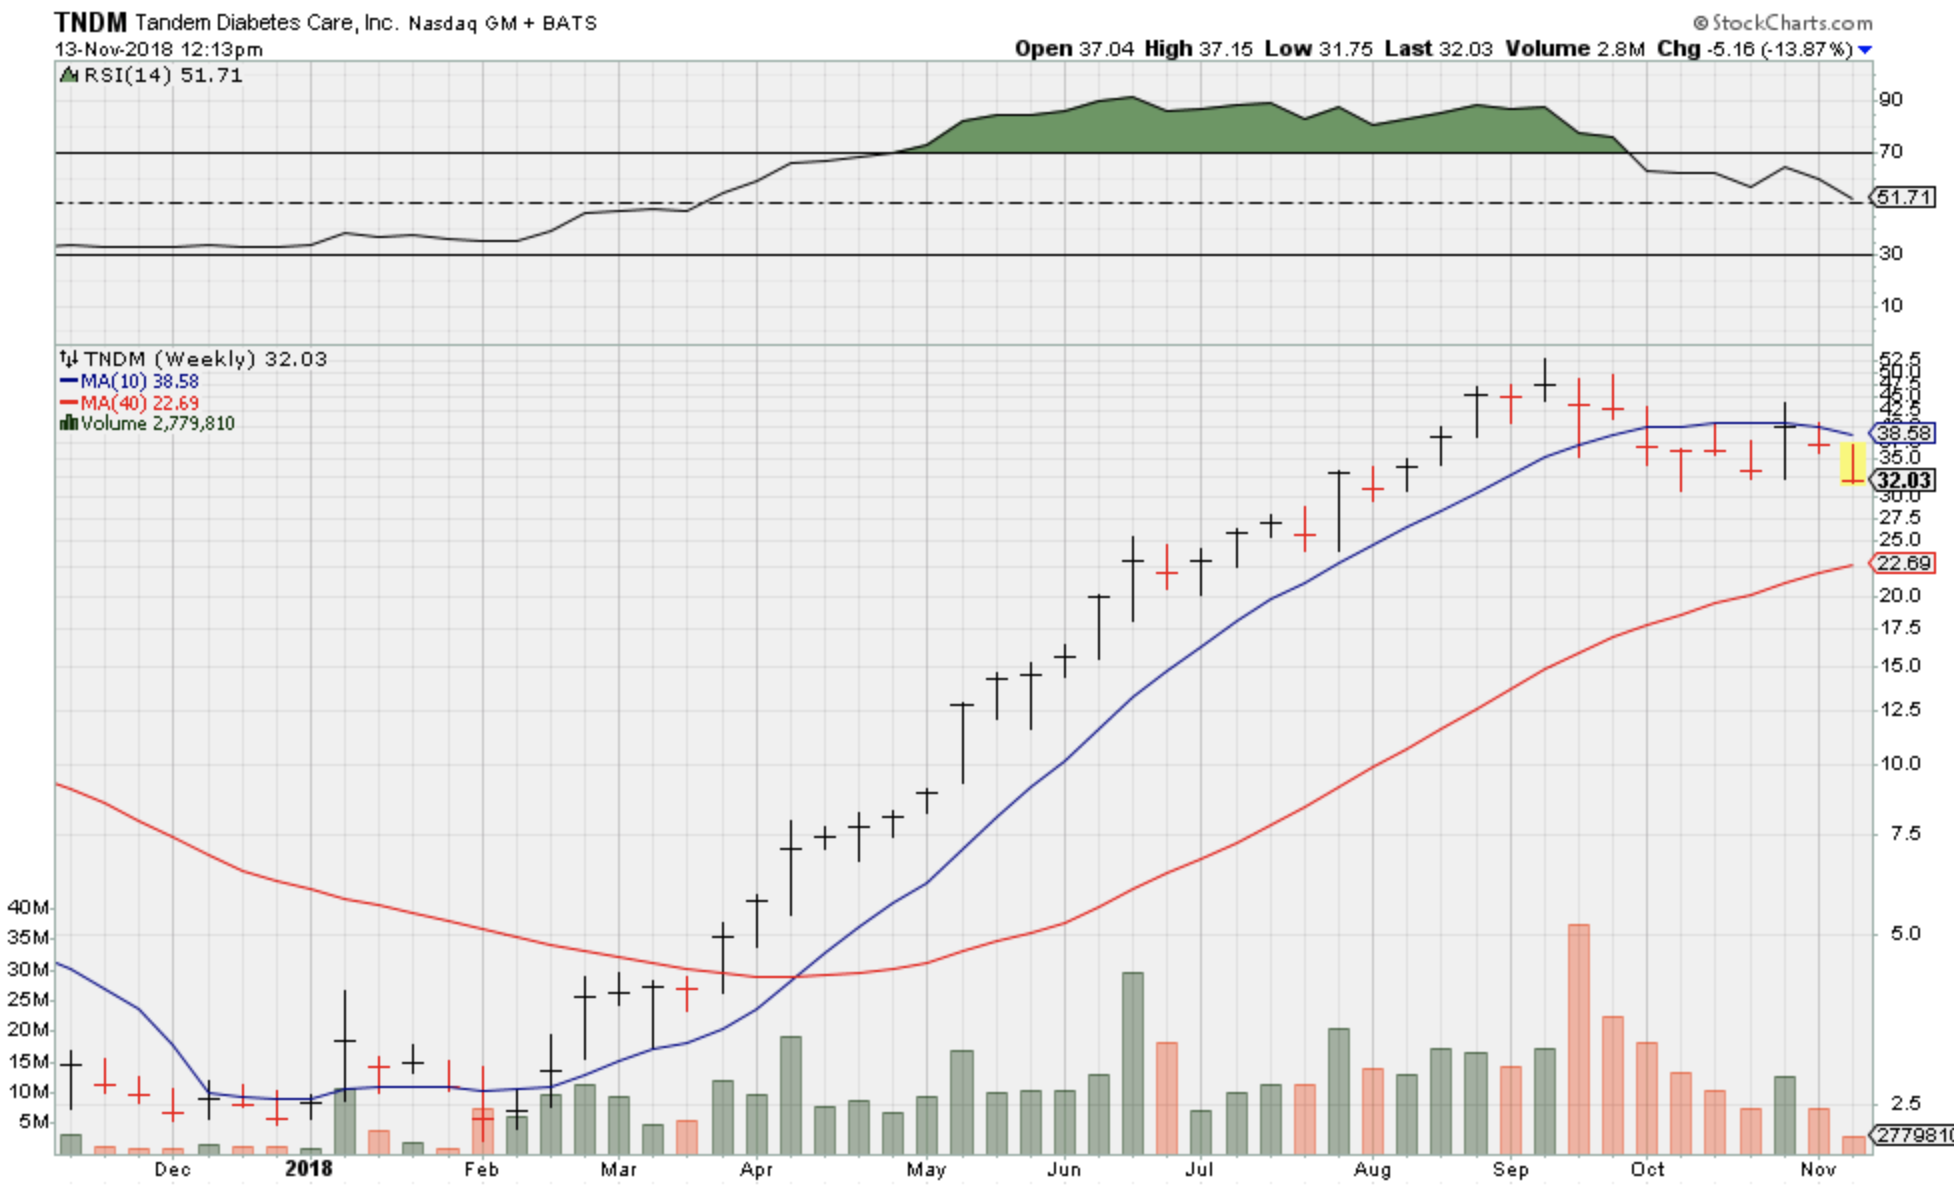
Unless you’re an aspiring analyst, keeping up with all the bells and whistles that go into the technical side of things isn’t really worth your time, especially since you can tell a lot just from the share trajectory alone.
It’s simple. If prices are trending up along with these blue and red lines that we refer to as moving averages, there’s a good chance they’ll continue to do so.
As you can see, these moving averages are now beginning to level out, hinting that we’ve likely seen the best of this 2,353% increase.
For most investors that know what they’re doing, this was a signal to take the money and run. That’s easy enough to understand for the finish, but you may be wondering what qualifies as a good indicator for getting in.
For stocks like this, the rule of thumb is to buy once the 40-week moving average (red line) meets up with the share value. This tends to cause prices to bounce up.
Like any investment, it’s never a 100% guarantee that the market will function according to planned. Either way, it helps to have the insight that comes with technical and fundamental analysis at your disposal prior to buying in.
Moving forward, remember to stay up to date with current events that could possibly impact your investments and keep an eye out for what direction these moving averages are traveling in.
Who knows, if you play your cards right, you could earn yourself 2,353% worth of profits and multiply your money 22 fold!