 When the stock market behaves with as much volatility as it’s been doing lately, the need to find the best stock picks is even greater.
This year has already proven it’s not going to be like 2017, where you could invest in almost anything and make a profit.
Now, it’s more important than ever before to have a reliable source you can turn to so you’re making money, and not throwing it away.
Luckily, that’s exactly why you have me, and it’s why I track the insiders’ moves so closely (making sure you’re still making those 51% gains and more).
As I’ve said before, the insiders have access to information that average joe investors do not.
However, we can make up for that seeming disadvantage by learning how to predict the insiders’ moves before they’ve even been made.
That calls for some serious technical analysis and dedicated time spent following specific charts.
Once again, that’s why you have me.
Now, there are a number of factors I look for when I’m searching for strong stocks with admirable performances.
One factor I’m frequently drawn to is their earnings history.
This is just an easy way to see how the company has been performing when compared to Wall Street (and the insiders’) expectations.
I also like to look at how the stock has been doing recently. Normally, this is just valuable intel for determining what price point would be appealing to get in at.
In the current Wall Street climate, however, recent activity has become even more important since there has been so much market volatility.
The increased volatility makes stocks that remain stable, or even climb up, during that volatility even more impressive.
It’s also important to look at how a stock is performing in relation to its industry and sector.
Different analysts will use that information in different ways, but if a stock is performing well outside (either above or below) its respective industry and sector, you need to look for a reason for that behavior.
Finally, I find it helpful to look at a stock’s yearly return, again just to get a holistic view of its performance in the last year.
I use all of these factors to predict what the insiders will do, and then, where a stock will move.
So, now that you know part of my process, let’s take a look at a stock I’ve been keeping my eye on, and the stats that get me excited.
Federal Agricultural Mortgage Corporation (AGM), also known as Farmer Mac, is in the Financial Services sector and provides a secondary market for various loans made to borrowers in the United States.
AGM has consistently beat earnings, quarter after quarter, by significant amounts.
In addition to that, AGM has seen unprecedented recent growth.
To really understand what I’m talking about, let’s take a look at the daily chart for AGM. I’ve annotated this chart so you can see the exact aspects that make this an interesting pick.
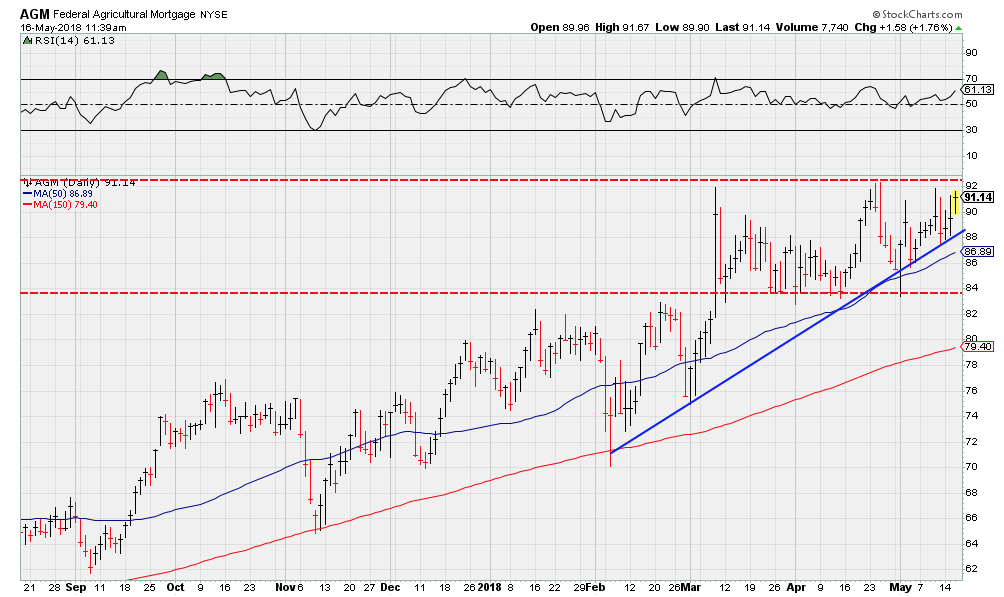
So, the first thing I’ll mention is the trendline I’ve drawn, starting in February.
This isn’t a particularly long-term trendline, as it’s only existed for a few months, but you can see how steeply it’s risen in those few months.
Additionally, there have been several points of contact with that trendline in the last two weeks, which is great since we really want to see good recent activity.
Now turn your attention to that lower dotted red line. I drew that in to show a line of resistance that became a line of support.
If you look closely, you can see that the stock really struggled to break past that line, sitting just under $84.
In early March, AGM broke above the line of resistance, and as the weeks continued it became a line of support.
The reason this is important is because of that second dotted red line, sitting just above $92.
That upper dotted red line is the new line of resistance, and you can see that AGM has failed to break above it, as of yet.
So, why do we care?
Well if AGM behaves as it did historically, we can hope that the new line of resistance will become a line of support, just as the previous one did.
That means we can predict that at some point in the near future, AGM will jump above $92 and continue up.
Now this careful analysis doesn’t guarantee what a stock will do—it just serves to illuminate us and give us the upper hand over the insiders.
In terms of how AGM has performed in relation to its sector/ industry…it has out-performed both its sector and industry by quite a bit.
Just take a peek at AGM’s weekly chart:
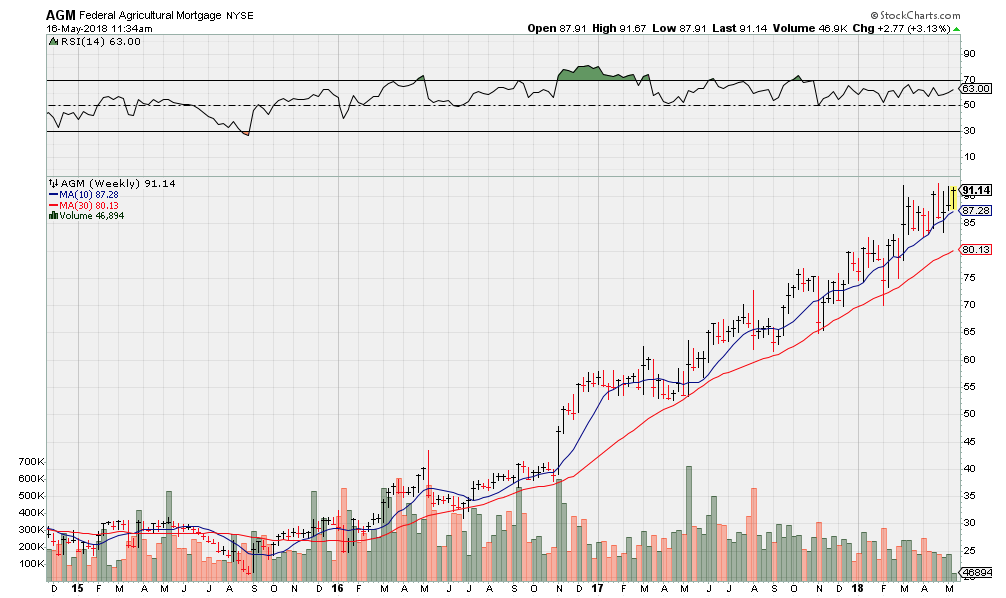
Clearly, 2017 and 2018 have seen huge gains for AGM.
While the financial sector (XLF) as a whole has performed better than others this year, AGM has still left the sector in its dust.
This wouldn’t be a good thing by default—there are always other factors you need to take into consideration.
But in the case of AGM, its strong performance and gorilla gains are definitely good things, and even more reason for you to keep your eye on this stock in the coming days and weeks.
The final stat I’ll leave you with is AGM’s one-year return: 51.47%
I know a year can seem like a long time in the stock market, but with the kind of volatility we’ve been seeing this year, profits like those are not to be missed!