 It’s impossible to know exactly what the stock market is going to do in the future, but there are several indicators, resources, etc. that can help us foresee certain things that could occur.
And with the bull market seemingly stuck in the mud right now, several such indicators are starting to turn.
When this indicator went off yesterday, it became time to grow concerned…
The market has grown extremely volatile over the past couple of weeks or so, and the past three days of drops didn’t help.
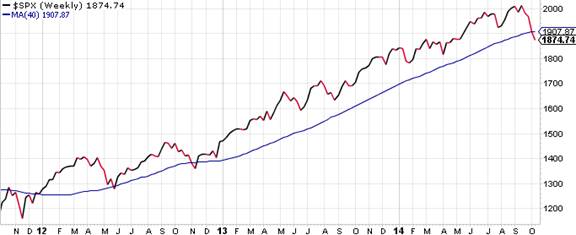
The benchmark S&P 500, which is an index of 500 large stocks that serves as a representative of the overall market, opened at 1,967.68 points last Thursday and closed at 1,874.74 points yesterday.
That is a humongous drop over a three-day span relative to how the market has been performing in recent history.
But that’s not even the scariest part…
What concerns me the most is the fact that yesterday’s big decline pushed the S&P 500 below its 200-day moving average, which is the average price of the S&P 500 over the last 200 days.
And it didn’t just creep past it either; it ended up about 30 points below it.
The S&P 500 hasn’t fallen below the 200-day moving average since November…of 2012!
You can see for yourself on this chart of the S&P 500 (SPX) from Stockcharts.com:
It’s annoyingly obvious and something that we can’t ignore. However, that doesn’t mean we have to panic or that we can’t make any money.
In fact, if this is indeed the end of the bull market like it appears to be, we will be able to make money even faster when the bear market begins thanks to the trading system taught in our Stock Code Breaker course.
So make sure to keep up with this column and take advantage of the resources available to Wall Street Informer members in order to put yourself in the best position to protect your investments and profit.
Click Here: Get a free Pick and the 7 Secrets to Finding Top Penny Stocks