 It doesn’t take much intuition to put two and two together and realize that you’ve reached this page for one reason and one reason only…
To profit from the stock market!
And what better way to hunt for these returns than by understanding how to read the charts themselves?
Here at WSI TV, our goal is to provide you with a backstage pass for cashing-out from the BEST stocks on the market, but it doesn’t hurt to learn a few tricks of the trade yourself.
BlueLinx Holdings (BXC) has climbed 375% since the start of this year, leaving many investors who missed out on the opportunity feeling as if it’s the one that got away.
Perhaps you’re one of them or maybe just a potential investor who’s interested in getting their foot in the door.
Either way, here’s a secret to identifying the warning signs that led up to this return and how to ensure you don’t miss out on all the action next time around.
When you’re on the prowl for profits in the market, some of the first things you should take into consideration are support and resistance lines.
Think of these lines as the surface to a body of water…
Simply put, a true line of support will act as a float that keeps shares buoyant and bouncing above this “waterline”, but rarely allows them to dip below it.
On the other hand, resistance does the opposite. As the name suggests, it causes stocks to sink beneath the line and resist breaching the surface.
I know what you’re thinking and NO, a stock under a resistance line is not necessarily a bad thing. Take BXC for example. Company shares were consistently suppressed below this resistance line for close to 3-years before it finally sprung up again.
Check out the chart for BXC below.
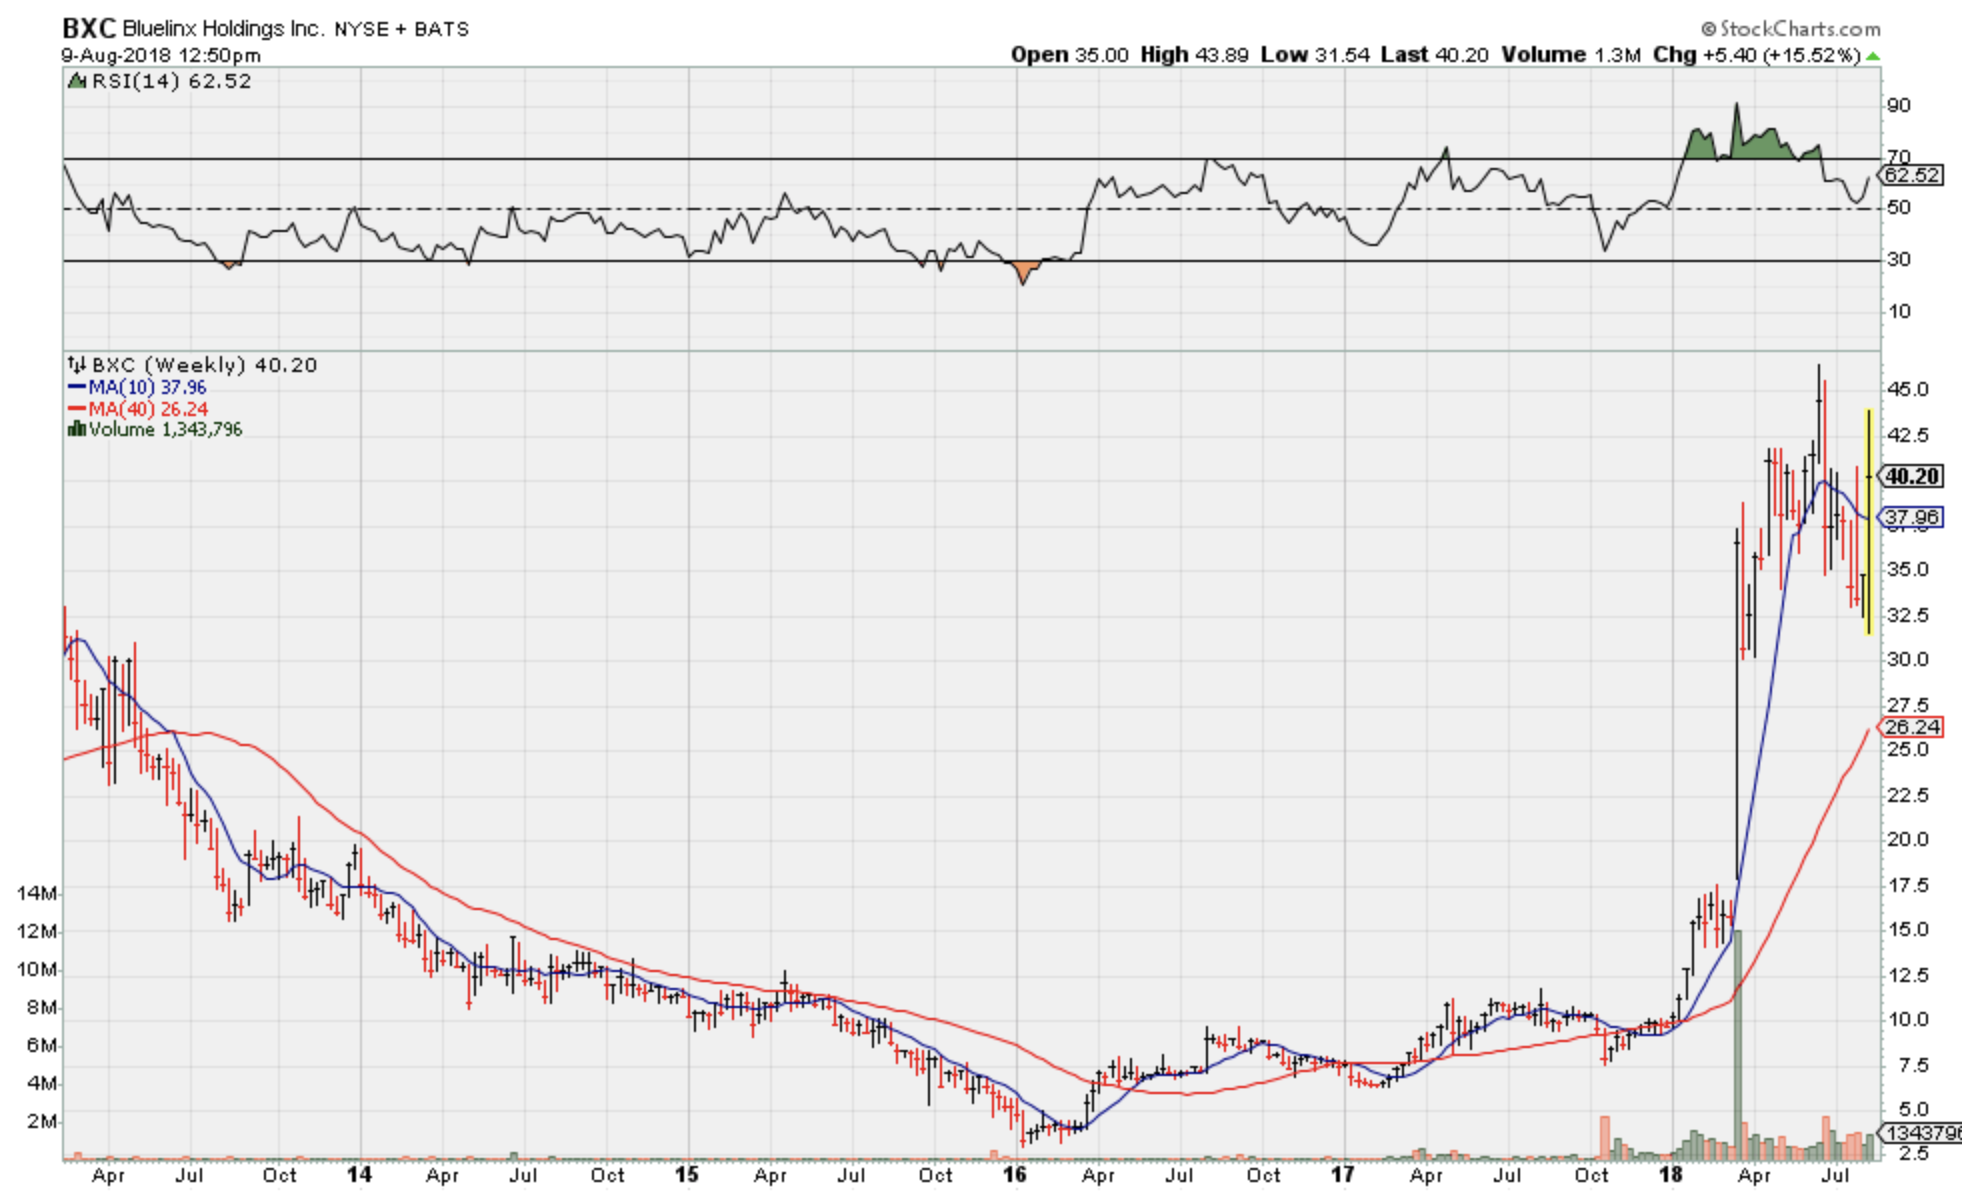
At first glance, you’ll notice that BXC began its downtrend in July 2013 as shares refused to top the resistance line, which you can see colored in red. Then throughout 2016 and 2017, it made attempts to turn this resistance into support.
You can see this line slowly transitioning into support near the end of 2017 and start of 2018. From then on, BXC bounced way above this line of support, driving share prices from $9.75 to as much as $46.42!
Although this particular stock now appears to be preparing for a dive, this same line of support should keep it afloat and potentially lead to another gain similar to the one that it produced before.
Once BXC shares collide with this line, chances are the stock will bounce back up and you don’t want to miss out on round 2 of these profits!
There are other factors that obviously play into reading charts and things can get a bit complicated at times, but you can apply this chart reading tactic to whatever stock you wish.
Just remember to look for support AND resistance. The secret to your success in the market very much depends on these lines.