 At this point that big scare of August feels like it happened years ago. Now the market is flying again, and the big question has switched from “Is this the beginning of the bear market?” to “How much higher can we go?”
It certainly feels like a new high is in the cards for Wall Street before any sort of correction is going to bring us all back down to earth, but that sentiment may not be telling the entire story.
Let’s look at both sides of the coin and see if we can pick out some vital information…
I want to take things 1 at a time and discuss what each could mean or how it has already impacted the market. Make sense? Good.
i. Interest rates
I know, all the talk about interest rates can be nauseating. But the potential for rate hikes has clearly had an impact on the market. Just before the August drop, the Federal Reserve was about to raise rates. When the drop happened, the Fed backed off. And when he market failed to recover right away, the Fed delayed rate hikes even further, which made investors scamper back to their buying ways.
The lack of hikes thus far has clearly helped the market climb up to the point it’s at now, but is that climbing artificial? The scary thing is that the Fed will have to hike rates at some point (potentially December), and that could wreak havoc on a sensitive market.
ii. August
We can look at the August action in 2 ways. First, you can say that it was a healthy correction that allowed the market to catch its breath. Or secondly, you can say that it showed significant weaknesses in the market that can’t be ignored.
And the fact that it took the market a couple of months to recover lends itself to the latter explanation.
iii. The driving force
It’s easy to look at the market right now and say, “Look, the market is skyrocketing so everything is in great shape.”
That’s simply not the reality. Roughly 50% of stocks have remained below their respective 200-day moving averages as of the start of the week. So only half the market has been pushing upward, and the driving force has been the big blue chips, not the majority.
That’s leaving the market vulnerable until more of the stock landscape can turn upward as well.
iv. The VIX
The VIX is the Volatility Index. And as you can see from this chart of the VIX from stockcharts.com, it’s nearing a pretty solid bottom:
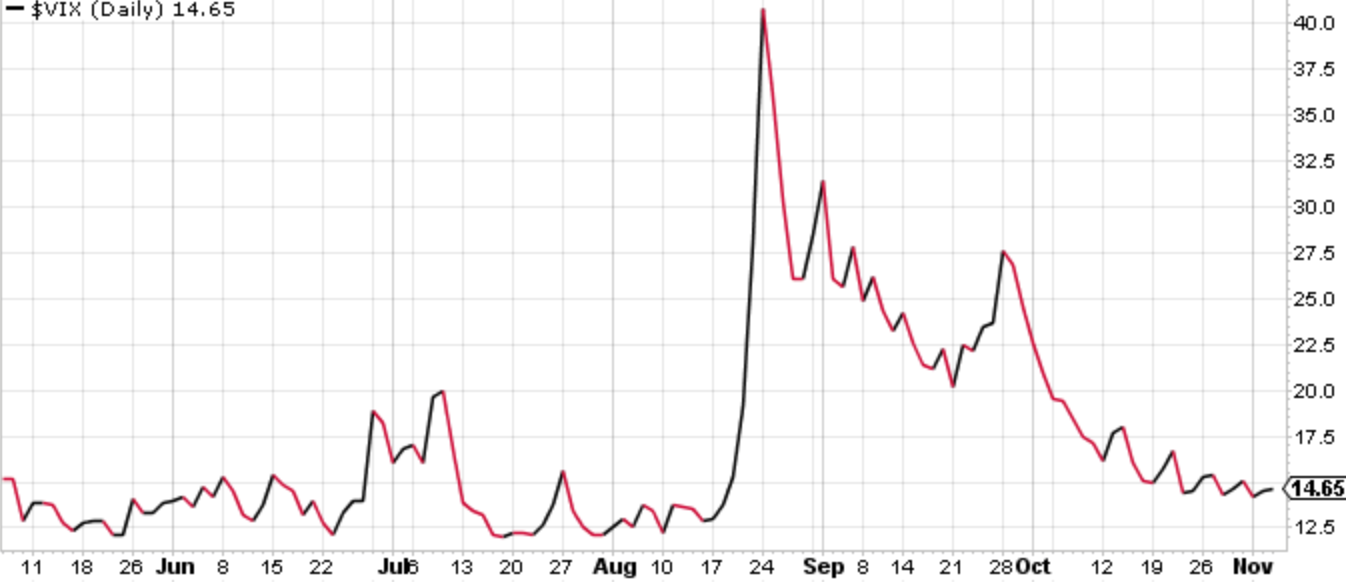
The VIX has failed to dip below that level of about $10 or $11, and it’s hanging around just slightly above that level now.
There looks to be enough room for the market to hit a new high, but how big of a bounce (downward) will there be for Wall Street when the VIX reaches down as far as it can go?