 You read that correctly…
I’m going to be handing out up to $2,000 per person to a lucky 200 people. Think of all the penny stock shares you could buy with that!
Imagine being given 400 shares of Apple back in 2005 when it was a $5 penny stock… that $2,000 would now be worth $62,400!
That’s what this is like. So, not only am I going to hand you $2,000, but I’m going to tell you how to turn it into a massive sum just like that Apple payout…
So, now you know you’re about to be given $2,000 to trade with however you like, let’s get you on track to trade the best possible penny stocks around.
First, let’s get you acquainted with these explosively profitable stocks…
What is a penny stock?
The term penny stock has many different meanings. To a lot of people, it’s taken quite literally as any stock that’s worth pennies (less than a dollar). Other people draw the line in the sand at anything below $5.
Our research has indicated that these definitions exclude a lot of stocks that move just like your traditional penny stocks.
We’ve seen that stocks ranging from $5-$10 can have the same explosive upside as their cheaper competitors… that’s why our penny stock range is under $10.
Low risk, high gain
Doesn’t the phrase “low risk, high gain” sound like the best possible investment attribute?
That’s what these select penny stocks have.
Take Best Buy (BBY) for example…
Back in 2012, Best Buy was trading around $9.65. Now, this wouldn’t have been considered a penny stock under the standard definition, but our definition would’ve covered this explosive stock.
At $9.65, Best Buy could’ve only gone to $0. And we all know that would never actually happen.
What Best Buy did next is why we consider anything under $10 a penny stock.
Over the next 5 years, Best Buy grew by 547%! That’s an average of 109% per year.
If you had put the $2,000 I’m about to hand you on a stock like this, you would’ve quickly turned it into almost $13,000!
So, what’s the one simple trick you can use to find this sort of reliable penny stock action?
Take a quick look at this chart of Best Buy from 2013:
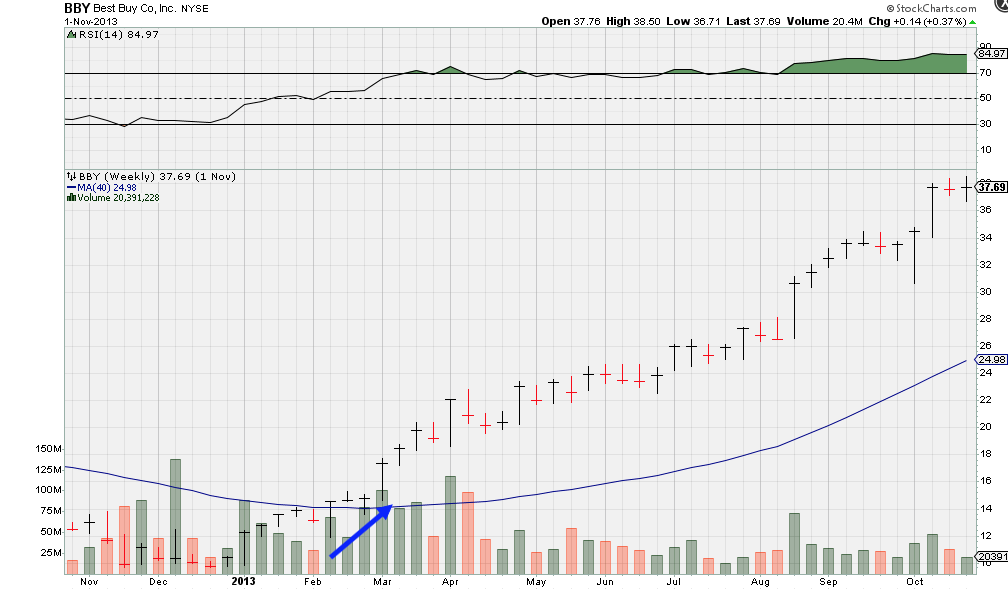
There’s two things we need to take note of here: The blue line spanning left to right (the 40-week moving average) and the red (selling) and grey (buying) volume bars across the bottom.
Now, as Best Buy’s price bars (the horizontal bars) breach that 40-week moving average, there’s a very telling sign that this penny stock is about to take off.
The arrow I’ve drawn shows the ascendance of the grey volume bars. This action is exactly what we’re looking for.
When a penny stock breaches its 40-week moving average AND the buying volume bars are stepping up like that, we can be sure this stock is about to take off.
That’s exactly what you should be looking for in the stocks you’re going to use this $2,000 on…
So, how do you claim the $2,000 I’m handing out?
All you have to do is buy any of our products between now and October 31st, and I’ll send you information on November 1st to tell you how you can claim your cash back.
Keep an eye on your inbox for more details about this countdown to your $2,000 cash back!