 Since the landmark OPEC decision, oil prices have been in a free-fall down to $31 a barrel – a 60% drop.
And with it, oil has dragged down the struggling stock market.
Now everyone is waiting for oil to finally hit rock bottom and bounce back upward, allowing for both a much-needed recovery and a BIG moneymaking opportunity.
Right now, here’s where oil needs to make its stand if it’s going to be able to begin its bounce anytime soon…
Oil may soon have to change its nickname from ‘Black Gold’ to ‘Black Bronze’ if it can’t regroup and start climbing soon.
An oversupply of oil has clearly been the primary reason for such a significant drop in the oil price, but the solution appears to be much more convoluted than simply limiting supply.
But thankfully we don’t have to sit back and wait on the policymakers, both foreign and domestic, to be our lighthouse in the night and guide us. Instead, we can count what we know from the oil price itself.
You see, you can find patterns in virtually everything in the financial markets – Stocks, commodities, whatever.
And oil is absolutely not an exception…
Let me quickly show you a chart of the United States Oil Fund (USO), which clearly tracks the price of oil, thanks to Stockcharts.com:
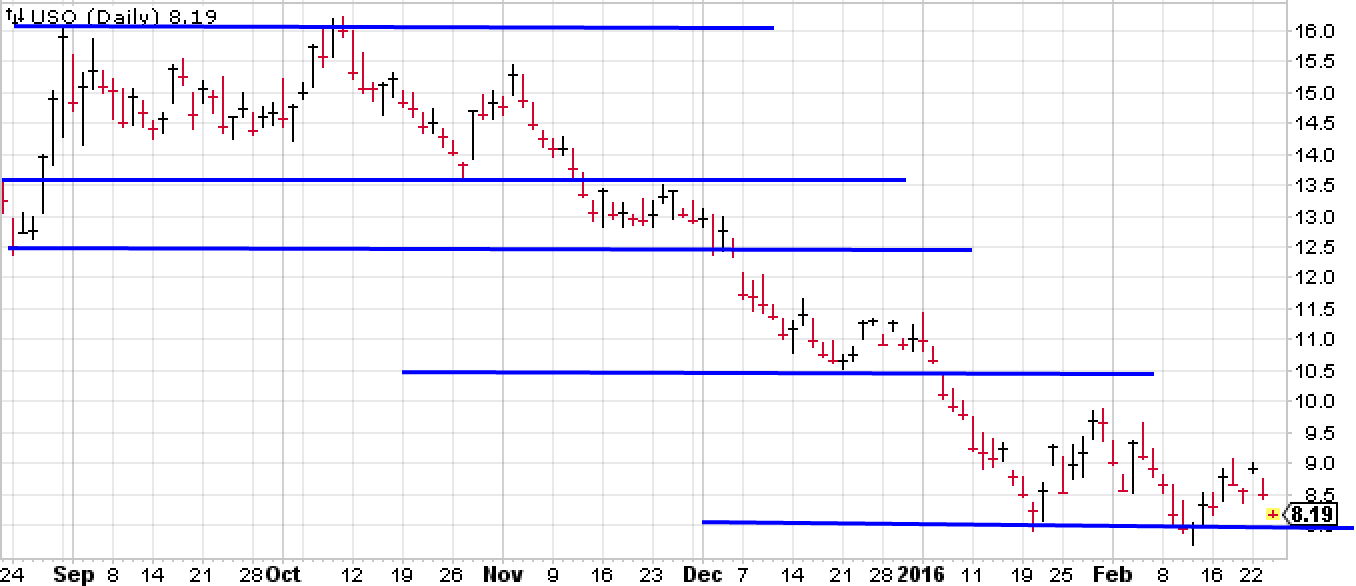
I’ve taken the liberty of drawing those horizontal blue lines onto the chart of USO, and each one represents a particular line where the USO price bounced at least a couple of times.
Can you see how these lines show the gradual stepping down of oil?
Well, one such line will act as the point for the oil price to bounce upward when it eventually stops falling and begins climbing – this is based on the principle that these lines represent the price points at which investors form a “line of resistance” from further descent by buying USO.
At least until now, those lines of resistance have only been able to repel the oil price from dropping for 2 or 3 instances before finally giving way. But if oil is to ever rebound, one of these blue lines will hold for good.
And it just so happens that USO is once again approaching a blue line – that one at the bottom of the chart.
This line, now at approximately $8 a share of USO, is the current line in the sand for oil. If oil doesn’t bounce there, it should once again break down until the next blue line of resistance forms.
But if it does bounce, it would only take a return to October levels to give you a 100% return if you’re in at $8!
These are some of the secrets used in Code Breaker to show you how to make easy money on stocks. Be on the lookout for a special invitation for it…