 Although it’s only 1 small part of the equation, I have a secret weapon that helps me clearly see when there’s a big chance for a really nice payday.
The best part is that all you need to know in order to access this secret weapon are 3 letters and 1 number. It’s really that easy.
Ready to find out what this secret weapon is?
The very first thing I try to teach people who are learning about how to invest the right way is that the overall market is an incredibly powerful force when it comes to investing in anything on Wall Street, even individual stocks.
Take the benchmark S&P 500 (SPX). Where the SPX goes, so does the majority of securities in the stock market.
And it’s incredibly difficult for most stocks to fight against the market, much like trying to swim against the current.
So anytime you can get a good idea of where the market is moving in the immediate future, you give yourself a great chance to make some easy money.
And that takes us to the secret weapon of mine that can help me see when the market is almost certainly going to bounce downward…
Here’s all you need to know to make this secret work in your favor:
- 3 Letters: V, I, and X
- 1 Number
I’m talking about what’s called the Volatility Index, ticker code VIX.
Also known as the “investor fear gauge”, the VIX shows the market’s expectation of 30-day volatility.
Probably the most important thing to know about the VIX is that it usually moves inversely to the stock market, so if the SPX goes up, the VIX will likely be going down.
Now take a look at this chart of the VIX from stockcharts.com:
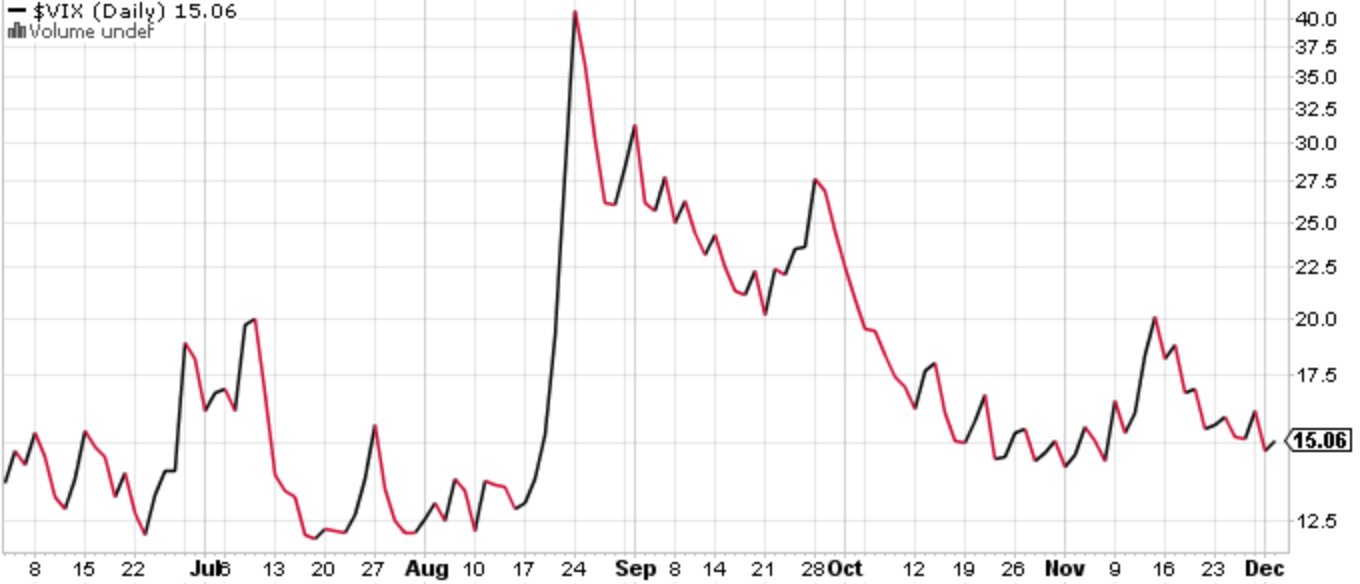
So you can see how the huge spike in the middle of this chart occurred at the same time as the big market dip in August, right? There’s that inverse movement I was talking about.
But what’s more interesting is when you look at the bottom of the chart – do you see how there appear to be imaginary lines stopping the VIX from reaching down any further in a couple of places.
In the left half of the chart that imaginary line was at about 12. In the more recent right half, that number has been at about 14.
Is this secret weapon making sense to you now?
Because it’s an inverse index, when the VIX hits one of those imaginary lines and is about to bounce upward, you know that the overall market or SPX will be bouncing downward!
And like I said before, when you know where the market is headed, there are plenty of ways to make a quick, easy payday.