 Staying one step ahead of everyone else on Wall Street would give your investment portfolio a highly profitable upper hand. You’d know exactly when to get in and out of trades at the perfect moment.
This secret pattern will keep you one step ahead at all times, and I want to map it out for you so you can see it in motion.
This pattern can be found all over the stock market, and now you won’t have to miss out on explosive profits any longer.
Even the most experienced broker doesn’t know about this secret pattern.
It’s something that’s not widely known around the stock market, and brokers wouldn’t be allowed to use it even if they knew how.
They simply watch the news and make guesses about stocks that could go up. It doesn’t really matter to them what actually happens in the chart. As long as you’ve got your money in their account, they’re happy.
For example, each time tensions heat up with the likes of China and North Korea, the “experts” turn toward defense stocks in order to try keep your money in their hands.
But do they tell you when you should get out? No, because they want to keep you in the stock for as long as possible—up or down.
Raytheon (RTN) is a defense company that supplies the tomahawk missiles that the U.S. uses.
As it happens, its stock has also been climbing in a strong pattern. While the brokers may have told you to buy this stock every time tensions become high, they won’t tell you exactly when you should take your profits.
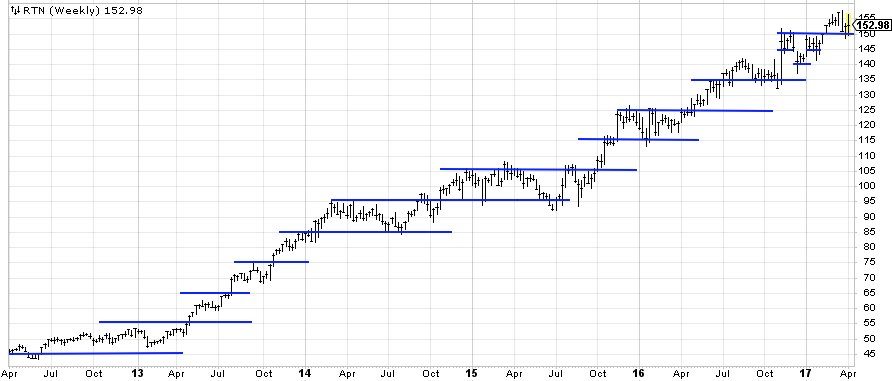
Look at this historical chart for Raytheon below.

Can you see the special steps that I’ve outlined in blue?
Each time the price of RTN reached these blue lines it bounced off. And if it did break right through them, it climbed in very positive ways.
If you would’ve bought shares of RTN in early 2013 when the boxes began to form, you would’ve tripled your money from this.
So, what action do you take as the stock approaches these line?
Well, if it hits a lower line (support), you buy. Then when it hits a higher one (resistance), you sell.
When it breaches a higher line, it enters a new price box. This is when you’d buy more shares.
It’s all about watching the timing of the bounces, and waiting for the perfect moment to make your move.
It may sound like a lot of buying and selling, but why would you hold the stock when it’s on its way down?
By selling each time it turns down, you’re maximizing your profits to their full potential.
So keep an eye out for this special pattern in other stocks—it’s very common in today’s market.
If we see a stock that’s approaching a line of support, our buy signals go off and we send it straight to our Midas Wave Alert subscribers.


Thank you
Yes, I’m all in. I will be signing up very soon.
Thank you.
WSI TV on Demand
Long Term Trend Indicator
Recent Headlines
3 Simple Tricks FORCE the stock market to pay YOU
The next Stock Market Winning Lottery Ticket
It’s this EASY to triple your money…
Makes the market experts work for YOU
Your 4 Step Profit Plan
Profit with the Pros with these 3 Shortcuts
How to Profit in a Bear Market (3 Steps)
How to Profit in a Bear Market (3 Steps)
It’s this EASY to triple your money…
Calling ALL stock market newbies…
© WSI Associates, Inc. 1706 E. Semoran Blvd., Suite 114 Apopka, FL 32703. All Rights Reserved.
Partner With Us | Website Terms & Privacy Policy